


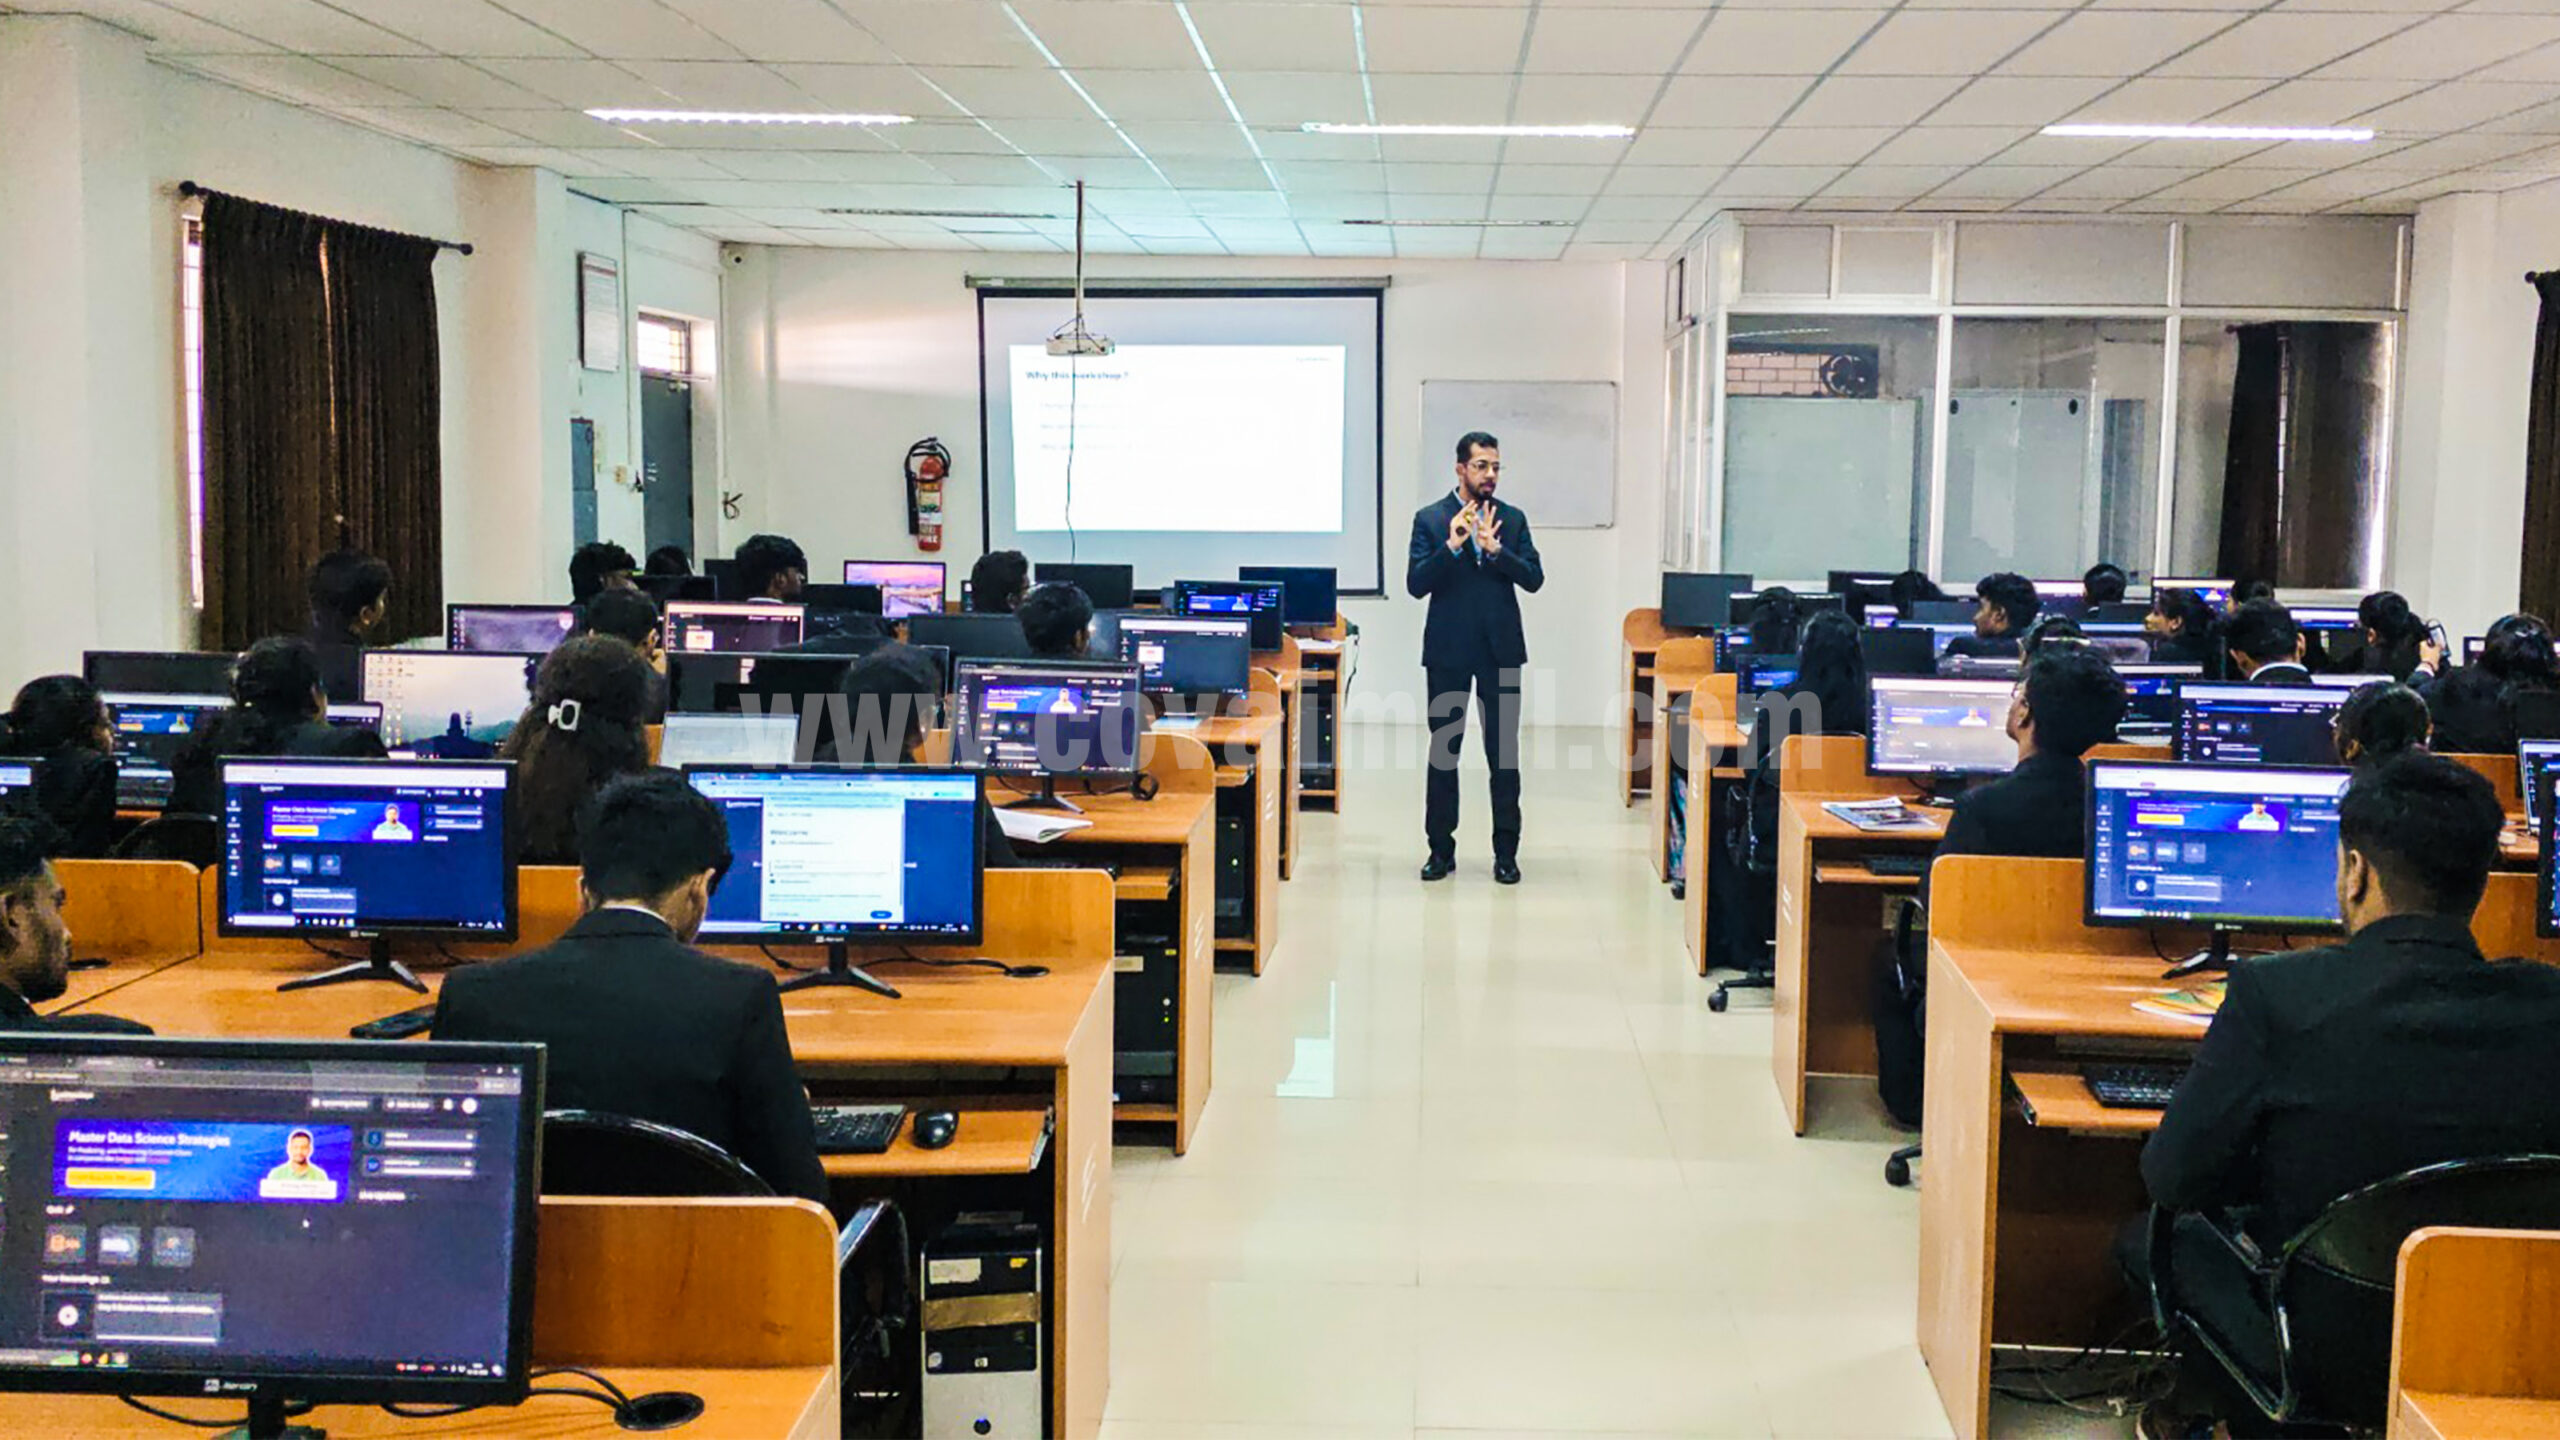
KV Institute of Management and Information Studies (KVIM), Coimbatore, organised a five-day training program on ‘Business Analytics and Data Visualization’ for the MBA 2025 batch recently at the college.
The program was conducted by corporate professionals from the analytics industry, providing students with practical exposure to real-world business data and industry-relevant tools.
The training focused on enhancing analytical thinking, data handling, and decision- making skills using Advanced Excel, Power BI, and Tableau.
Programme Highlights
Day 1 introduced the fundamentals of Business Analytics using a real-time dataset of over 40,000 records. Students performed data analysis using pivot tables, charts, and dashboards, along with descriptive statistics and regression concepts.
Day 2 focused on Advanced Excel techniques, including data cleaning, logical functions, lookups, and creating dynamic dashboards.
Day 3 covered multiple regression analysis and performance dashboards, as well as a practical assessment and a real-world analytics project.
Day 4 provided hands-on training in Power BI, where students built interactive dashboards using a hospitality booking dataset to analyse trends, customer behaviour, and revenue.
Day 5 introduced Tableau through the Smart Bazaar case study, emphasising best practices in data visualization and comparative analytics.
The program enhanced students’ understanding of Business Analytics, strengthened their practical skills in Excel, Power BI, and Tableau, and improved their ability to analyze and visualize real-world business data.
The corporate-led training program effectively bridged the gap between academic concepts and industry practices. It equipped students with job-ready analytics skills and reinforced KVIM’s commitment to experiential learning and industry collaboration.

